3D Mapping of Vacant Buildings for Reuse
- Povl Filip Sonne-Frederiksen
- Projects
- March 11, 2025
Table of Contents
The Environmental Imperative: From Demolition to Reuse
The construction industry currently stands as one of the most significant contributors to environmental degradation, accounting for approximately 40% of global greenhouse gas emissions. To meet the urgent demands of climate change mitigation, a fundamental shift is required: we must move away from the linear “take-make-waste” model of demolition and new construction and transition toward a circular economy. In this paradigm, existing buildings are viewed not as obstacles to development, but as valuable banks of materials and spaces to be maintained, repaired, or repurposed. Despite the clear environmental and regulatory incentives—such as the European Regulation on Taxonomy and new national CO2 budgets—architects face a daunting practical hurdle. Many of our existing, vacant structures suffer from a total lack of documentation. Original drawings are frequently missing or outdated, and undocumented modifications made over decades make it nearly impossible to accurately assess a building’s reuse potential without a costly and time-consuming manual survey. This research addresses this “documentation gap” by proposing a faster, more flexible way to map the built environment.

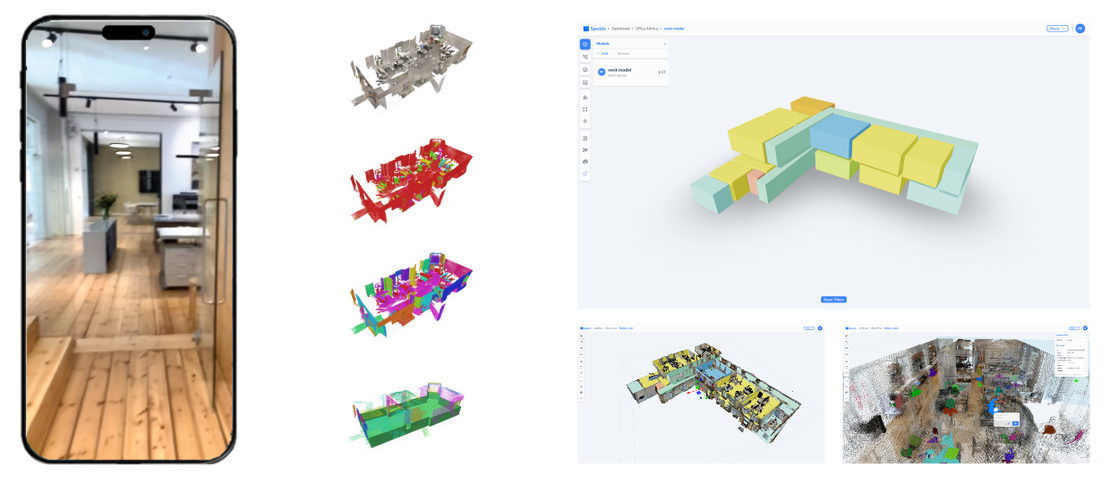
Introducing ReUseX: Democratising 3D Mapping
Traditional 3D scanning solutions, while precise, are often ill-suited for the early phases of a project. High-end LiDAR scanners are expensive, require specialised operators, and often produce data in proprietary formats that lock architects into specific software ecosystems. My research introduces ReUseX, an open-source pipeline designed to automate building mapping using consumer-grade hardware—specifically the LiDAR-enabled iPad Pro or iPhone.
By leveraging devices that architects already carry in their pockets, ReUseX lowers the barrier to entry for building documentation. The tool is built on a high-performance C++ foundation, utilising professional geometric libraries like CGAL and PCL, while providing Python bindings to ensure it remains accessible to the growing community of computational designers who script their own architectural workflows.
The Technical Hurdle: The Chaos of Point Clouds
To understand the complexity of this task, one must understand the nature of the data produced by LiDAR. A scanner generates a point cloud, which is essentially a massive, unordered collection of millions of individual points, each defined by its X, Y, and Z coordinates. While these clouds provide a stunningly accurate record of the physical environment, they are fundamentally unstructured. A computer does not inherently know that one group of points represents a chair while another represents a wall. For an architect to perform a daylight study or an energy simulation, this “dust” of points must be converted into structured data, such as polygonal meshes or Constructive Solid Geometry (CSG), where surfaces and volumes are mathematically defined. ReUseX bridges this gap through a two-pronged approach: semantic segmentation to identify objects and solid surface model construction to define the architectural space.

Phase 1: Teaching Computers to See in 3D
The first stage of the ReUseX pipeline focuses on semantic segmentation—the process of identifying and labelling specific objects within the scan. Rather than attempting to train a computationally expensive model to understand raw 3D points directly, ReUseX leverages the power of 2D Computer Vision. As the architect walks through a building, the iPad captures both RGB video and corresponding depth maps.
We process these video frames using the YOLO (You Only Look Once) model, a state-of-the-art machine learning architecture that can detect objects like furniture and equipment in real-time. Once an object is detected in a 2D frame, we use a projection matrix—calculated from the camera’s focal length and orientation—to “push” those labels back into 3D space, effectively painting the point cloud with semantic information. Finally, Euclidean clustering is applied to group these labelled points into distinct physical instances, allowing for the automated generation of a building component inventory.

Phase 2: Constructing the Simplified Surface Model
While identifying furniture is essential for material inventories, architectural analysis requires a clean, “watertight” model of the rooms themselves. The point cloud is often too “noisy” or incomplete to be used directly for this purpose. To solve this, ReUseX employs an analytical reconstruction process that begins with planar region growing. The algorithm identifies flat surfaces by selecting “seed” points and expanding to neighbours that share the same orientation, effectively isolating walls, floors, and ceilings.
To distinguish between different rooms, we use a technique inspired by graph theory. By casting mathematical rays between planar patches, we can determine which surfaces have a “direct line of sight” to each other. This data is then processed using Markov Clustering (MCL), which simulates random walks through the connectivity graph to group surfaces into distinct room volumes. This allows the system to understand the building’s topology—where one room ends and another begins—without any manual input.

The Mathematical “Room-Maker”: The LIP Solver
The final challenge is to assemble these detected planes into a solid, usable 3D model. We generate a cell complex, which can be visualised as a complex 3D “cage” formed by the intersection of all detected planes. To find the most accurate representation of the room within this cage, we employ a Linear Integer Programming (LIP) solver.
The solver is tasked with selecting the specific faces from the cell complex that maximise “point coverage” (how well the face matches the actual scan) while also prioritising “complexity reduction” (keeping the model as simple as possible for analysis software). Most importantly, the solver is constrained to ensure that the resulting model is watertight and manifold, meaning it has no holes and represents a mathematically valid volume. This level of structure is what allows the data to be used for advanced simulations like Radiance daylight factor calculation.
Integration and the Future of Circular AEC
To ensure that ReUseX is not just a theoretical exercise but a practical tool, it is integrated with Speckle, an open-source cloud platform for the AEC industry. This allows the processed data—both the segmented object inventory and the structured room models—to be streamed directly into industry-standard software like Rhino, Revit, or ArchiCAD.
The automation of the “Scan-to-BIM” process represents a vital step toward a more sustainable built environment. By providing architects with a fast, affordable way to document vacant buildings, ReUseX facilitates early-phase analysis and informed decision-making. While challenges such as “sensor drift” remain, future developments in SLAM (Simultaneous Localisation and Mapping) and the integration of voice annotations promise to make building mapping a seamless part of every architect’s site visit.